Material Anlysis
X-ray Scattering and diffraction techniques
Investigating the structure information by X-ray Scattering and diffraction techniques
A. Sample : The monolayer of FePt nanoparticles basic structure
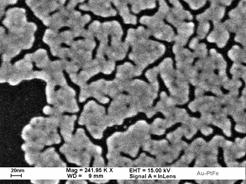 Figure A. Surface topography of the Au/FePt nanoparticle on the PEI functional substrate. |
In order to apply on real hard disk product, a perfect monolayer of magnetic nanoparticles was a requisite goal. As prepared, the FePt nanoparticles were spherical, superparamegnetic, with a disordered face-centered cubic (fcc) structure. In order to enhance the ferromagnetic property, the nanoparticles were annealed at temperatures above 550 °C to convert the structure from disordered fcc to L10 phase. |
However, at high temperature, particles cohered and the self-assembled structure was destroyed. In order to increase the stability of superlattice structure as monolayer, the chemical methods by using polymer coating on the surface were reported to control single particle layer on the substrate. Those polymers such as polyethylenimine (PEI) or [3-(2-aminoethlyamino) ropyl]trimethoxysilane (APTS) play a linking role to combine the silicon dioxide on the substrate surface and the surfactant on the particle surface. However due to the limitation of disordered orientation of those polymers, the original self-organized behavior of the nanoparticle system has been destroyed and the stacking condition of those particles on the surface was not compact any more. Complying with this structure, an overlayer of Au had been considered to keep the particle intact at follow-up processes. For enhancing the magnetic and structure stability, the essential factors that Au coverlayer can do are based on (i) the immiscibility between FePt and gold system, (ii) the pinning effect on the interface, (iii) reducing the exchange integral (Jex) between each particle and (iv) prevent the oxidation of FePt nanoparticles when annealing at high temperature. Figure A. shows the scanning electron microscopy image of the sample before annealing process. From the SEM image, we can see several FePt particles agglomerate together can be seen and the 30% area is covered by nanoparticles.
B. Diffraction anomalous fine structure
Figure B. shows the diffraction anomalous fine structure (DAFS) spectrum which measured at BL12b2 in SPring 8, Japan. The DAFS means that measures the elastic Bragg reflection intensities versus photon energy. This new method combines the long-range order and crystallographic sensitivities of x-ray diffraction with the spectroscopic and short-range order sensitivities of x-ray absorption techniques [8]. In the extended fine structure region, DAFS provides the same short-range structural information as EXAFS: the bond lengths, coordination numbers, neighbor types, and bond disorders for the atoms surrounding the resonantly scattering atoms. In the near-edge region, DAFS provides the same structural and spectroscopic sensitivities as XANES: the valence, empty orbital and bonding information for the resonant atoms. Because DAFS combines the capabilities of diffraction, EXAFS and XANES into a single technique, it has two enhanced sensitivities compared to the separate techniques:
- Wavevector selectivity. DAFS can provide EXAFS- and XANES-like information for the specific subset of atoms selected by the diffraction condition.
- Site selectivity.
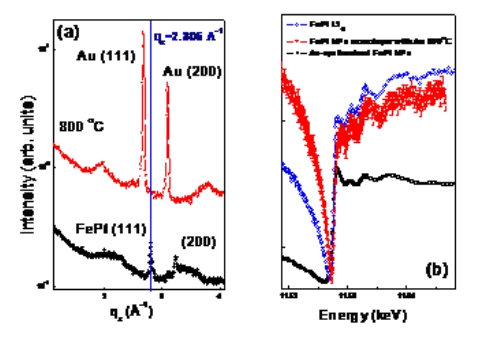 |
Figure B. The XRD and diffraction anomalous fine structure spectrum of Au over FePt nanoparticles system annealed at 800 °C (solid circle at b), (a) which measured at qz equal to 2.806 A. (b) Also with standard order FePt L10 (open circle) and as-synthesis disorder FePt nanoparticles (open cubic). |
C. Anomalous grazing incident small angle x-ray scattering
Since the heterogeneous material, such as silicon, might become an essential factor to prevent the aggregation behaviour during the annealing, the annealing process also can be carried out on an Au covered FePt nanoparticles monolayer system. However, the XRD data shows no FePt diffraction peak detectable after high temperature annealing. It possibly indicates that those FePt nanoparticles are not aggregated and the sizes are still too small to be detected under the strong diffraction background of Au matrix. The SEM image also shows that the Au overlayer aggregates and grows into a larger domain, which is consistent with the XRD results. However, the particles size of FePt nanoparticle after annealing process cannot be observed from the SEM image also due to the Au matrix. One essential method is using anomalous grazing incident small angle x-ray scattering (anomalous GISAXS) or anomalous diffraction to distinguish the particles size after the annealing process. In order to further verify the particle integrity of FePt nanoparticles after 800 °C annealing, a grazing incidence SAXS (GISAXS) experiment was performed. The result indicates that the characteristic size of the nanoparticle becomes larger after adding the Au overlayer both before and after annealing. From both the GISAXS and XRD results, the particles distribution after annealing was hard to be determined. The gold with heavier electron density dominates the scattering intensity. In addition, due to the similar electron density between the Au and FePt, to use the GISAXS technique alone cannot distinguish the morphology of FePt nanoparticles from the Au matrix. Thus, the anomalous GISAXS provides extra platinum information which comes from the FePt nanoparticles.
Figure C. shows the results of anomalous GISAXS of the FePt nanoparticles monolayer on the functional APTS substrate with Au coverlayer before annealing and after annealing. After adding Au as a coverlayer, morphology conformity and close electron density between Au and FePt give rise to a great difficulty to recognize the rigidity of nanoparticles during the annealing process. The Au layer might cover the surface of FePt nanoparticles and remain a similar shape. However, from preliminary fitting results, the particles retain intact in the Au matrix before the high temperature annealing. After the 800 °C annealing process for 1 h, significant feature peaks at Q between 0.6 to 1 (nm-1) was disappeared, which might indicate the surface morphology became more flat and smooth.
Figure D. shows the subtraction of two SAXS curves measured at two different energies E1 (11.2 keV) and E2 (11.564 keV), together with the simulation result to describe the scattering curves. The averaged radius R0 of particles is changed insignificantly from 2.4 ± 0.3 nm to 2.25 ± 0.25 nm within the error bars after the annealing process. But the mean distance D0 (the distance from the particle surface to the surface of neighbours' particle) is reduced from 7.5 ± 1.5 nm to 5.5 ± 1.1 nm. The closer D0 distance might be caused by the burning away surfactants or the Au morphology changes as we observed from SEM images. Nevertheless, from the simulation results of anomalous GISAXS, the size of FePt particle keeps intact in the Au matrix even when the annealing temperature increasing up to 800 °C. Due to the immiscibility between Au and FePt, the Au can be a useful material to keep FePt nanoparticles separated. To prevent the aggregation of FePt nanoparticles during the necessary annealing process, adding Au overlayer on top of the FePt monolayer enhances the stability of the FePt nanoparticles. The particle size of monolayer FePt nanoparticles can remain small to fit the ultrahigh density demand for the next generation magnetic disk.
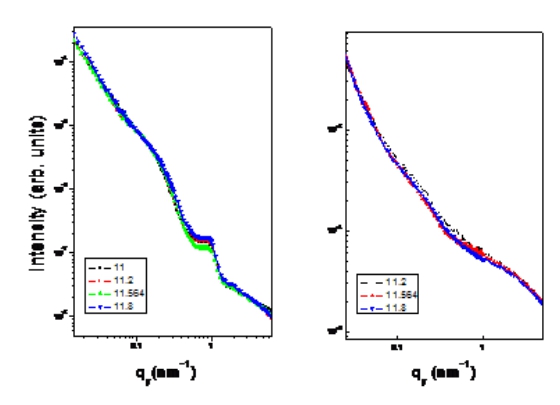 |
Figure C. GISAXS spectra of monolayer FePt nanoparticles with Au overlayer a) before annealing and b) after annealing at 800 °C for 1h. |
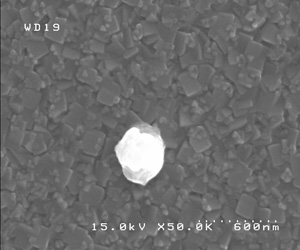 |
Figure D. The subtraction of two SAXS curves measured at two different energies E2 (11.2 keV) and E (LIII) (11.564 keV) together with the simulation results. The spectrum shows the morphology with the monolayer of FePt system without Au coverlayer before annealing (open square), with Au coverlayer system before the annealing (soild circle) and after 800 °C annealing process (open circle). |